Economics

Policy Uncertainty *before* 30% Tariffs on EU, Mexico … and Rosie O’Donnell

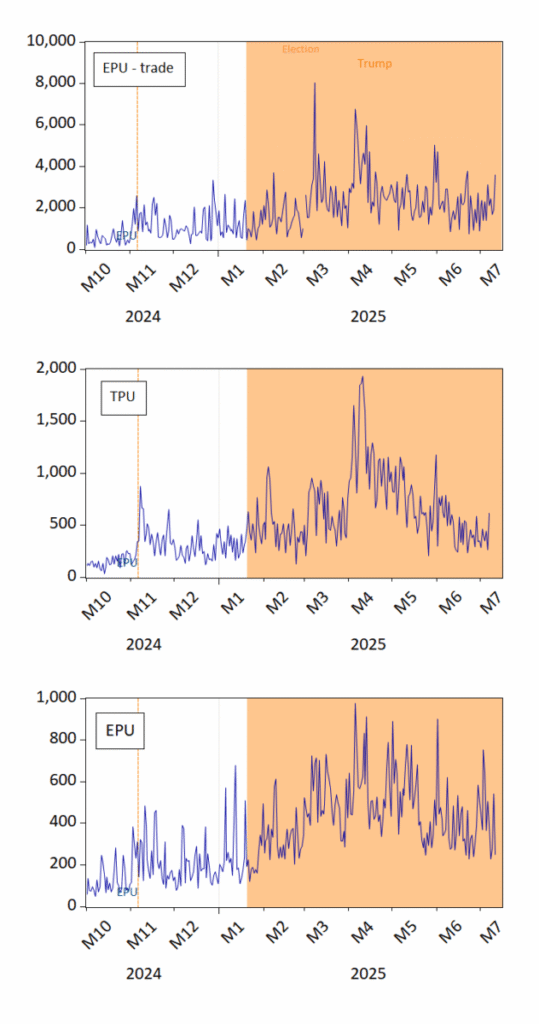
See here and here. Every morning I wake up, think I can’t see anything more crazy than what occurred yesterday, and then I check the news. Figure 1: Top panel, EPU-trade; Middle panel: Trade Policy Uncertainty; Bottom panel: EPU. Orange shading denotes second Trump administration. Orange dashed line denotes election. Source: policyuncertainty.com, Iacoviello et al. […]

Policy Uncertainty *before* 30% Tariffs on EU, Mexico … and Rosie O’Donnell Read More »

“The Office Sector’s Double Whammy”; Record High Office Vacancy Rate

by Calculated Risk on 7/11/2025 03:55:00 PM From Nick Villa at Moody’s The Office Sector’s Double Whammy The ongoing challenges affecting the office sector have not only resulted in deteriorating space market fundamentals—evidenced by the record-high national office vacancy rate in the second quarter of 2025—but have also had a direct negative impact on capital

“The Office Sector’s Double Whammy”; Record High Office Vacancy Rate Read More »

Realtor.com Reports Most Active “For Sale” Inventory since December 2019

by Calculated Risk on 7/11/2025 02:48:00 PM What this means: On a weekly basis, Realtor.com reports the year-over-year change in active inventory and new listings. On a monthly basis, they report total inventory. For May, Realtor.com reported inventory was up 28.9% YoY, but still down 12.9% compared to the 2017 to 2019 same month levels. 

Realtor.com Reports Most Active “For Sale” Inventory since December 2019 Read More »

Calculated Risk: Q2 GDP Tracking: Mid-to-high 2s

by Calculated Risk on 7/11/2025 11:40:00 AM From BofA: Since our last weekly publication, our 2Q GDP tracking is down two-tenths to 2.3% q/q saar. [July 11th estimate]emphasis added From Goldman: [W]e have lowered our Q2 GDP tracking estimate by 0.6pp to +3.0% (quarter-over-quarter annualized). Our Q2 domestic final sales estimate stands at +0.7%. [July

Calculated Risk: Q2 GDP Tracking: Mid-to-high 2s Read More »

June Alternative Indicators Down from Peak

Civilian employment adjusted to NFP concept, manufacturing production, real retail sales, ADP’s private NFP, and BTS freight services index. The sole exception is the Philadelphia Fed coincident index, based on labor indicators. Figure 1: Implied Nonfarm Payroll early benchmark (NFP) (bold blue), civilian employment adjusted smoothed population controls adjusted to NFP concept (orange), manufacturing production

June Alternative Indicators Down from Peak Read More »